Start Here: What a Knowledge Graph Is
What you'll take away
- A knowledge graph is a map of what your business knows: the people, companies, contracts, and products in your documents — and, crucially, how they connect.
- It's different from a pile of files. Folders store documents; a graph stores what the documents say, so one question can pull an answer from many documents at once.
- Running one happens in one place — a dashboard with four tabs, each answering a different operator question.
- This module starts from zero: first what a knowledge graph is, then the short list of habits that keep one accurate and worth asking.
Try the knowledge graph interactive tool to learn the basics
What is a knowledge graph?
Start with a question you'd struggle to answer quickly: if my main supplier raises prices in March, which customers feel it? The answer exists in your business. It's spread across a supply contract, two customer agreements, and a handful of emails. Every document holds a piece; no document holds the picture.
A knowledge graph is that picture, assembled for you. Software reads your documents and pulls out the things they mention — people, companies, contracts, products, dates — along with the connections between them: this contract is with that supplier. This product depends on that material. This renewal is owned by that account manager. Things plus connections, drawn as one living map of your business.
The map is the point, because a map lets you follow a route: Northwind Co. → buys → Widget Pro → made with parts from → Acme Materials → contract renews → March. That route is the answer to the supplier question, and once the map exists you trace it in seconds instead of reconstructing it across an afternoon of open files.
This is also the thing a folder full of documents can't do. Folders and keyword search work at the level of documents: search "Acme" and you get back every file that mentions Acme. But your question wasn't "which files mention Acme" — it was "who feels it when Acme's prices change," and that answer lives in the connections between files. A knowledge graph stores what the documents say, so the connections are already there to follow.
A map needs a manager
A warehouse and a warehouse manager are two different things. The warehouse is the inventory — the shelves, the bins, what's actually on them. The manager is the person who decides what gets stocked, walks the aisles to catch what's mislabeled, notices the slow-moving stock gathering dust, and plans the next reorder. A warehouse with no manager slowly turns into a pile.
A knowledge graph is the same story. The graph is the inventory — the things your documents mention and the connections between them. But a graph nobody tends drifts the same way an unmanaged warehouse does: stale facts pile up, low-value clutter crowds out the things that matter, and trust erodes. The value isn't in having a graph. It's in operating one.
That's what the rest of this module teaches. You've just read the "what it is" half; everything from here on is the operating half — the short list of habits that keep the map accurate, current, and worth asking. None of it requires a technical background. If you can run a warehouse, a kitchen, or a client roster, you can run a knowledge graph.
Where the controls live
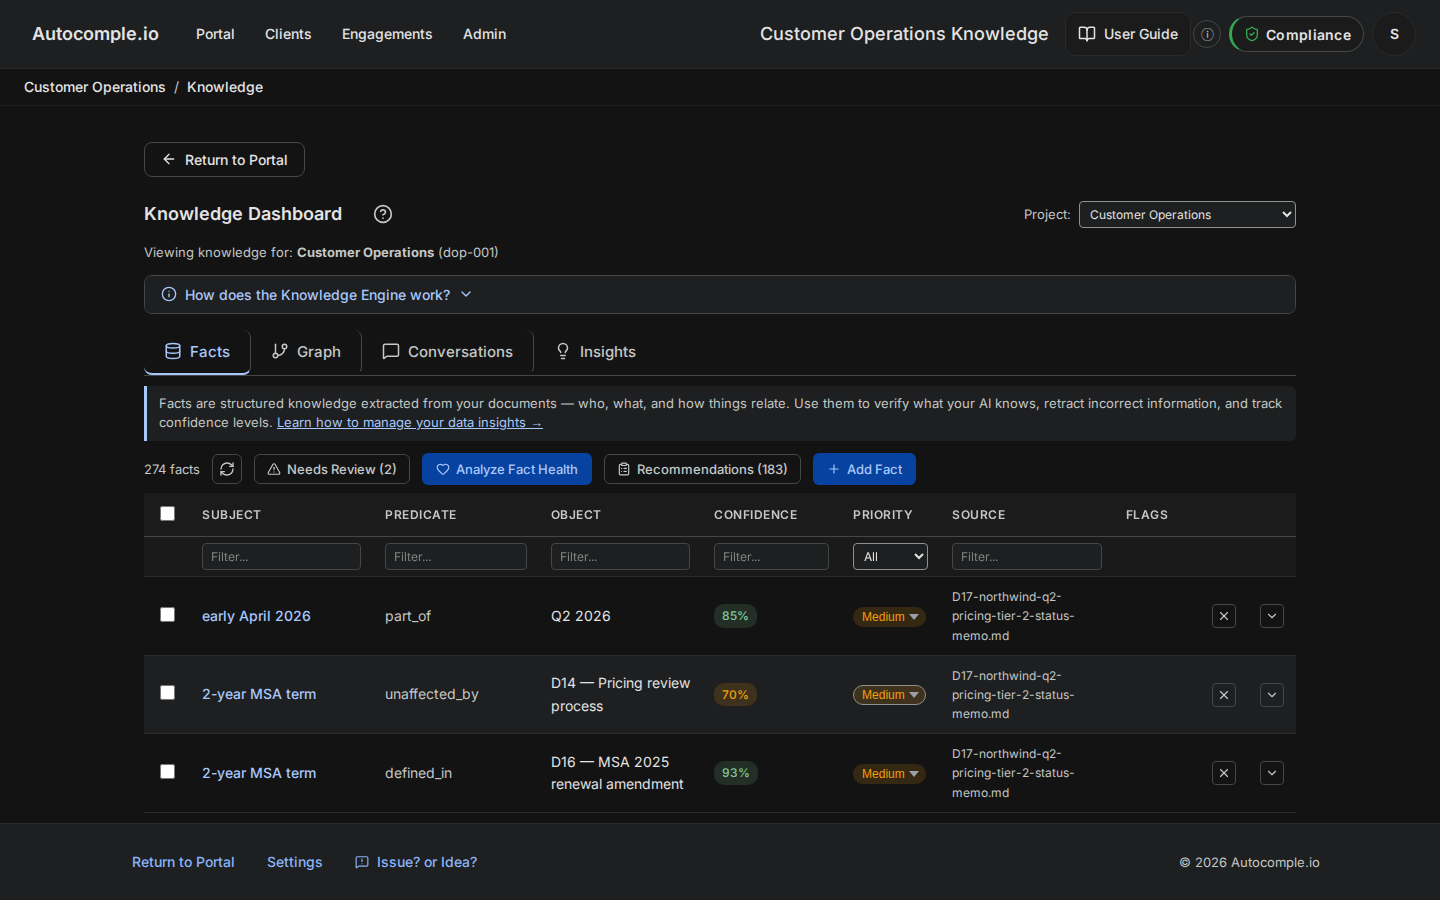
Here's how the operating half looks in practice. Everything an operator does happens on one screen: the Knowledge Dashboard. It has four tabs, and the cleanest way to remember them is that each one answers a different question you'll have as the person responsible for the knowledge base.
- Facts — What does the system actually know? Every piece of knowledge the system has pulled out of your documents shows up here as a short, reviewable statement. This is where you confirm what's right, fix what's wrong, and prune what's noise.
- Graph — How does it all connect? The visual map: search to a starting point, expand a neighborhood, trace a path between two things. This is where the "graph" part earns its name.
- Conversations — What did people ask? A record of the questions your team brought to the knowledge base — a quiet signal of what people actually care about.
- Insights — What did the system notice that nobody asked about? Patterns, contradictions, and gaps the system surfaced on its own, waiting for a human to confirm or wave off.
You'll spend time in all four, but they aren't equal. Facts and Graph are where day-to-day operating happens. Conversations and Insights are where you step back and read the room.
The mental model
Hold this picture for the rest of the module: you are the manager walking the aisles, and the four tabs are four different walks through the same warehouse. One walk checks the stock (Facts). One walks the connections (Graph). One reviews what customers came in asking for (Conversations). One reads the manager's own notes about what's running low (Insights).
The order of the units that follow is the order the work tends to happen in real life — first you design what's worth tracking, then you get documents in, build the graph, navigate it, maintain it, and plan how it grows. We'll use one running example throughout: a synthetic demo company, "Northwind Co.," whose workspace is already stocked with contracts, contacts, a product, and a supplier. Nothing in it is real, which makes it a safe place to click around.
The quiet payoff
Most people who try a knowledge graph and walk away disappointed never actually operated one — they uploaded some documents, looked at a tangle of dots once, and left. The operators who get value treat it like the warehouse manager treats the warehouse: a thing you walk regularly, with a short list of habits. The next eight units are those habits. Start with the one that pays off the most, which is deciding what belongs in the graph in the first place.
