Keeping It Healthy as You Grow
What you'll take away
- A knowledge graph is a garden, not a filing cabinet — it needs tending on a rhythm, not a one-time setup.
- The planning you did at the start and the maintenance you do day to day are the same loop, running on a cadence.
- Growth is deliberate: you add documents on purpose, and occasionally you add new types when the business itself changes.
- A short, regular operating rhythm beats a heroic cleanup every six months, every time.
A familiar analogy
Two gardeners plant the same beds in spring. The first does a heroic weekend of work, then doesn't come back until the weeds have swallowed everything, at which point they do another heroic weekend. The second spends fifteen minutes most weeks — pull a few weeds, notice what's thriving, plant something new where there's room. By midsummer the second gardener's beds are clearly better, and they've spent less total effort. The difference isn't skill. It's cadence.
A knowledge graph rewards the second gardener. Everything you've learned in this module — designing what to capture, getting documents in well, navigating, confirming facts, reading conversations, triaging insights — isn't a setup checklist you run once. It's a small set of habits you run on a rhythm. The graph that stays valuable is the one somebody tends a little, regularly, rather than rescues occasionally.
The mechanic: the loop closes
Here's the idea that ties the whole module together. The planning from Unit 01 and the maintenance from Unit 05 aren't separate phases — they're the same loop, seen at two moments.
- Design says: these kinds of things matter, these don't (the type vocabulary; the attributes worth keeping).
- Feed says: here are documents, read the important ones deeply (Extraction Depth, Priority).
- Build turns documents into graph, automatically, with a deliberate rebuild when your design changes.
- Maintain says: confirm what's right, prune the noise, re-check what's stale (the Facts tab, fact health).
- Observe says: what are people asking, and what did the system notice? (Conversations, Insights).
- And observing feeds the next round of design — because the gaps people hit and the insights the system surfaces tell you what to capture next.
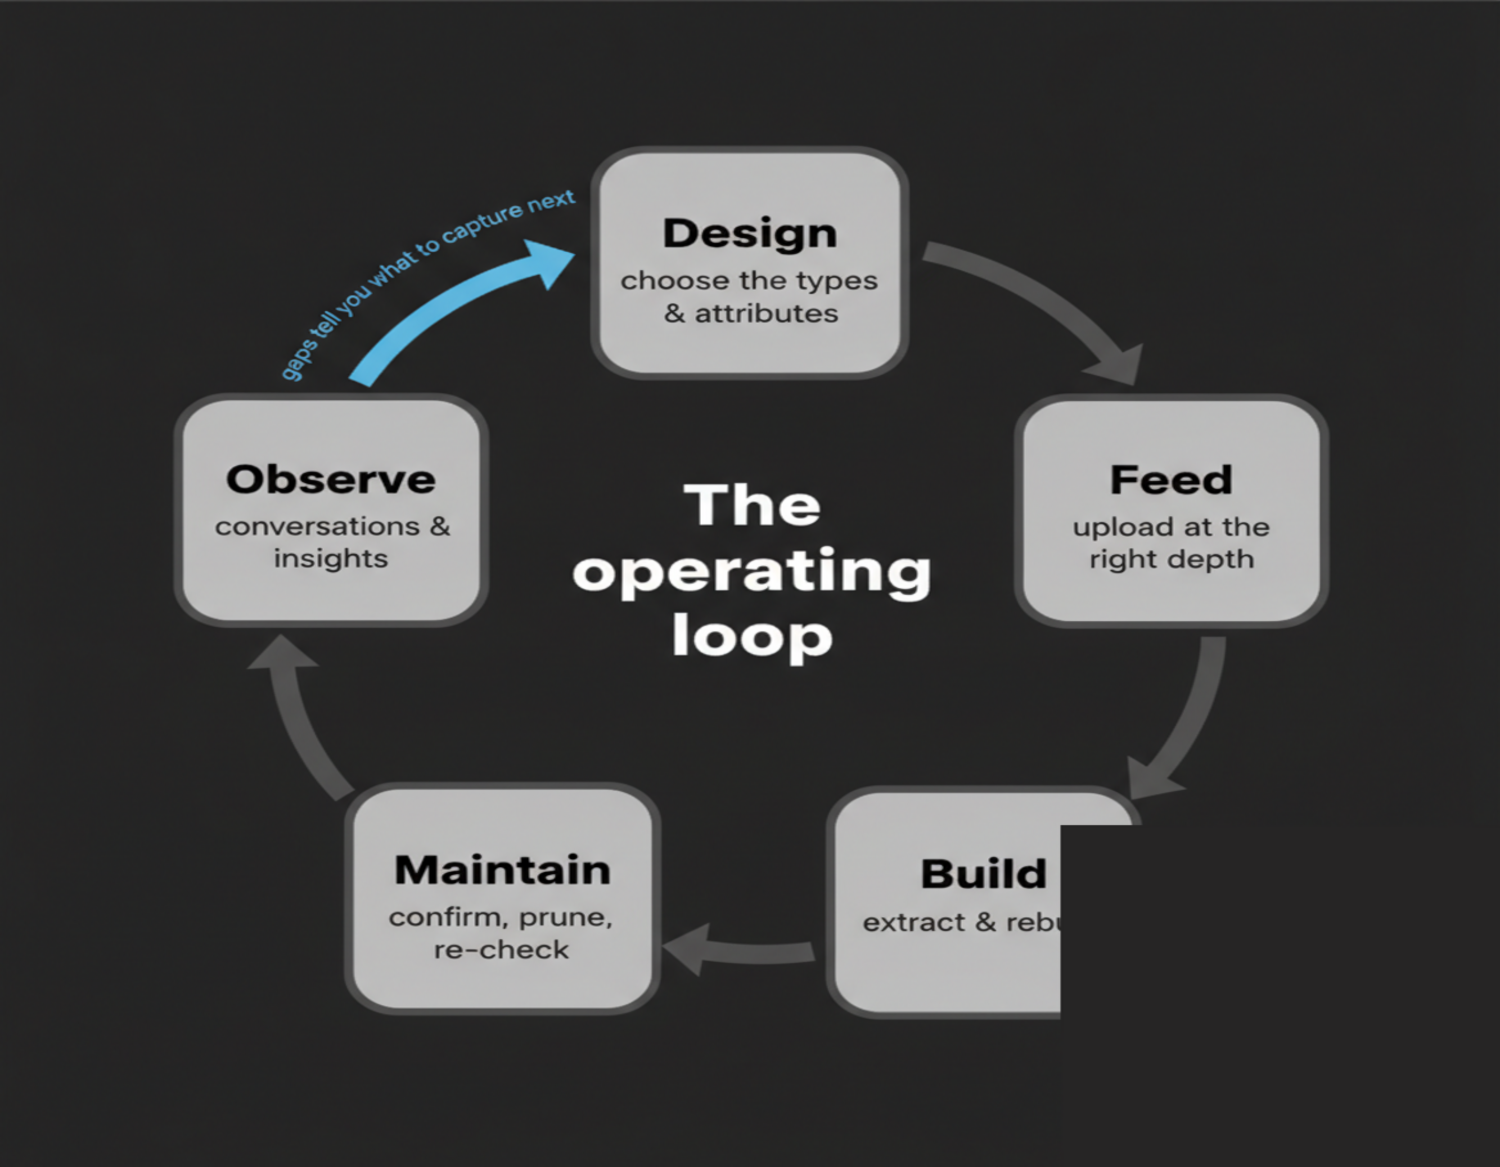
That last arrow — observe back to design — is the one most operators miss, and it's the most valuable. When a Knowledge Gap insight points at a missing owner, or the Conversations tab shows people repeatedly asking something the graph fumbles, that's not a complaint. It's a design instruction: capture this next.
Planning to expand
Growth happens two ways, and they call for different moves.
More of the same — your business does more of what it already does, and you have new documents about the same kinds of things. New contracts, new contacts, new product specs. This is the easy case: upload them at the right depth, and the graph grows on its own. Adding one contract document adds the contract entity, its connection to the customer, and whoever signed it — the graph gets denser without you doing anything special.
Something genuinely new — the business itself changes shape. You enter a new line of work, start tracking a kind of relationship you never tracked before, add a category of thing that didn't exist in your world last year. This is the case that calls back to Unit 01: you add new entity or relationship types to your vocabulary so the system starts looking for the new signal, and then you rebuild so your existing documents get re-read through the expanded lens. Adding documents grows the graph; adding types grows what the graph is capable of seeing.
Knowing which kind of growth you're facing tells you which tool to reach for. Most growth is "more of the same" — just upload. Occasionally it's "something new" — and that's when you revisit your type design, the highest-leverage move in the whole system.
The mental model
A short operating rhythm, repeated. Something like: skim the Insights inbox and the Conversations cards weekly; do a small Facts-tab pass when the staleness signals light up; revisit your type design when the business changes shape, and rebuild when you do. None of these is heroic. All of them, together, on a cadence, are the difference between a graph that compounds in value and one that quietly rots until someone declares the experiment a failure.
The quiet payoff
You started this module being told a knowledge graph is only as good as the person tending it. Now you know what tending looks like: a designed vocabulary, documents fed at the right depth, a graph you navigate confidently, facts you keep honest, and an inbox of insights you actually process — all on a rhythm, with each pass quietly improving the design for the next one. That's the whole job. It's less work than the heroic cleanup, it compounds instead of decaying, and it turns a pile of documents into a map of your business that gets sharper every time you walk it. You opened this module asking what a knowledge graph is; you're leaving as the person who knows how to run one.